 Dibyajyoti Kabi
If your WordPress site runs ads, there’s a good chance your INP score is worse than it should be. And there’s a good chance your own theme isn’t the reason.
I wanted to see this with real numbers, not guesses. So I took a live article on TheDroidGuru, a WordPress site I help run that uses Google AdSense Auto ads, and measured every tap on it with and without the ad and tag scripts.
I will show you what I found, where the time actually goes, the fixes I tried (one of them made things worse), and the code you can use to measure your own site.
If you want the bigger picture on Core Web Vitals for busy publishing sites, I covered that in Core Web Vitals on live newsrooms. This post goes deep on one metric.
What INP measures, in plain words
INP stands for Interaction to Next Paint. Every time someone taps a button, opens a menu or types in a box, the browser has to react and draw the result. INP measures how long that takes.
Google calls it good at 200 ms or less, needs improvement up to 500 ms, and poor above 500 ms. It’s judged at the 75th percentile of your real visitors, so a slow experience for one in four people is enough to fail it. INP replaced First Input Delay as a Core Web Vital on March 12, 2024.
Each interaction has three parts.
- Input delay. The time the tap waits because the browser is busy with something else.
- Processing. The time your click handler code takes to run.
- Presentation delay. The time it takes the browser to work out the new layout and paint it.
Keep those three in mind. They’re the key to everything below.
The site I tested
TheDroidGuru is a fairly lean WordPress site. It has a custom theme with one small JavaScript file, no jQuery, and no ad plugin. Ads come from AdSense Auto ads, added through Google’s Site Kit plugin.
Here’s what PageSpeed Insights showed for the homepage on October 3, 2026.
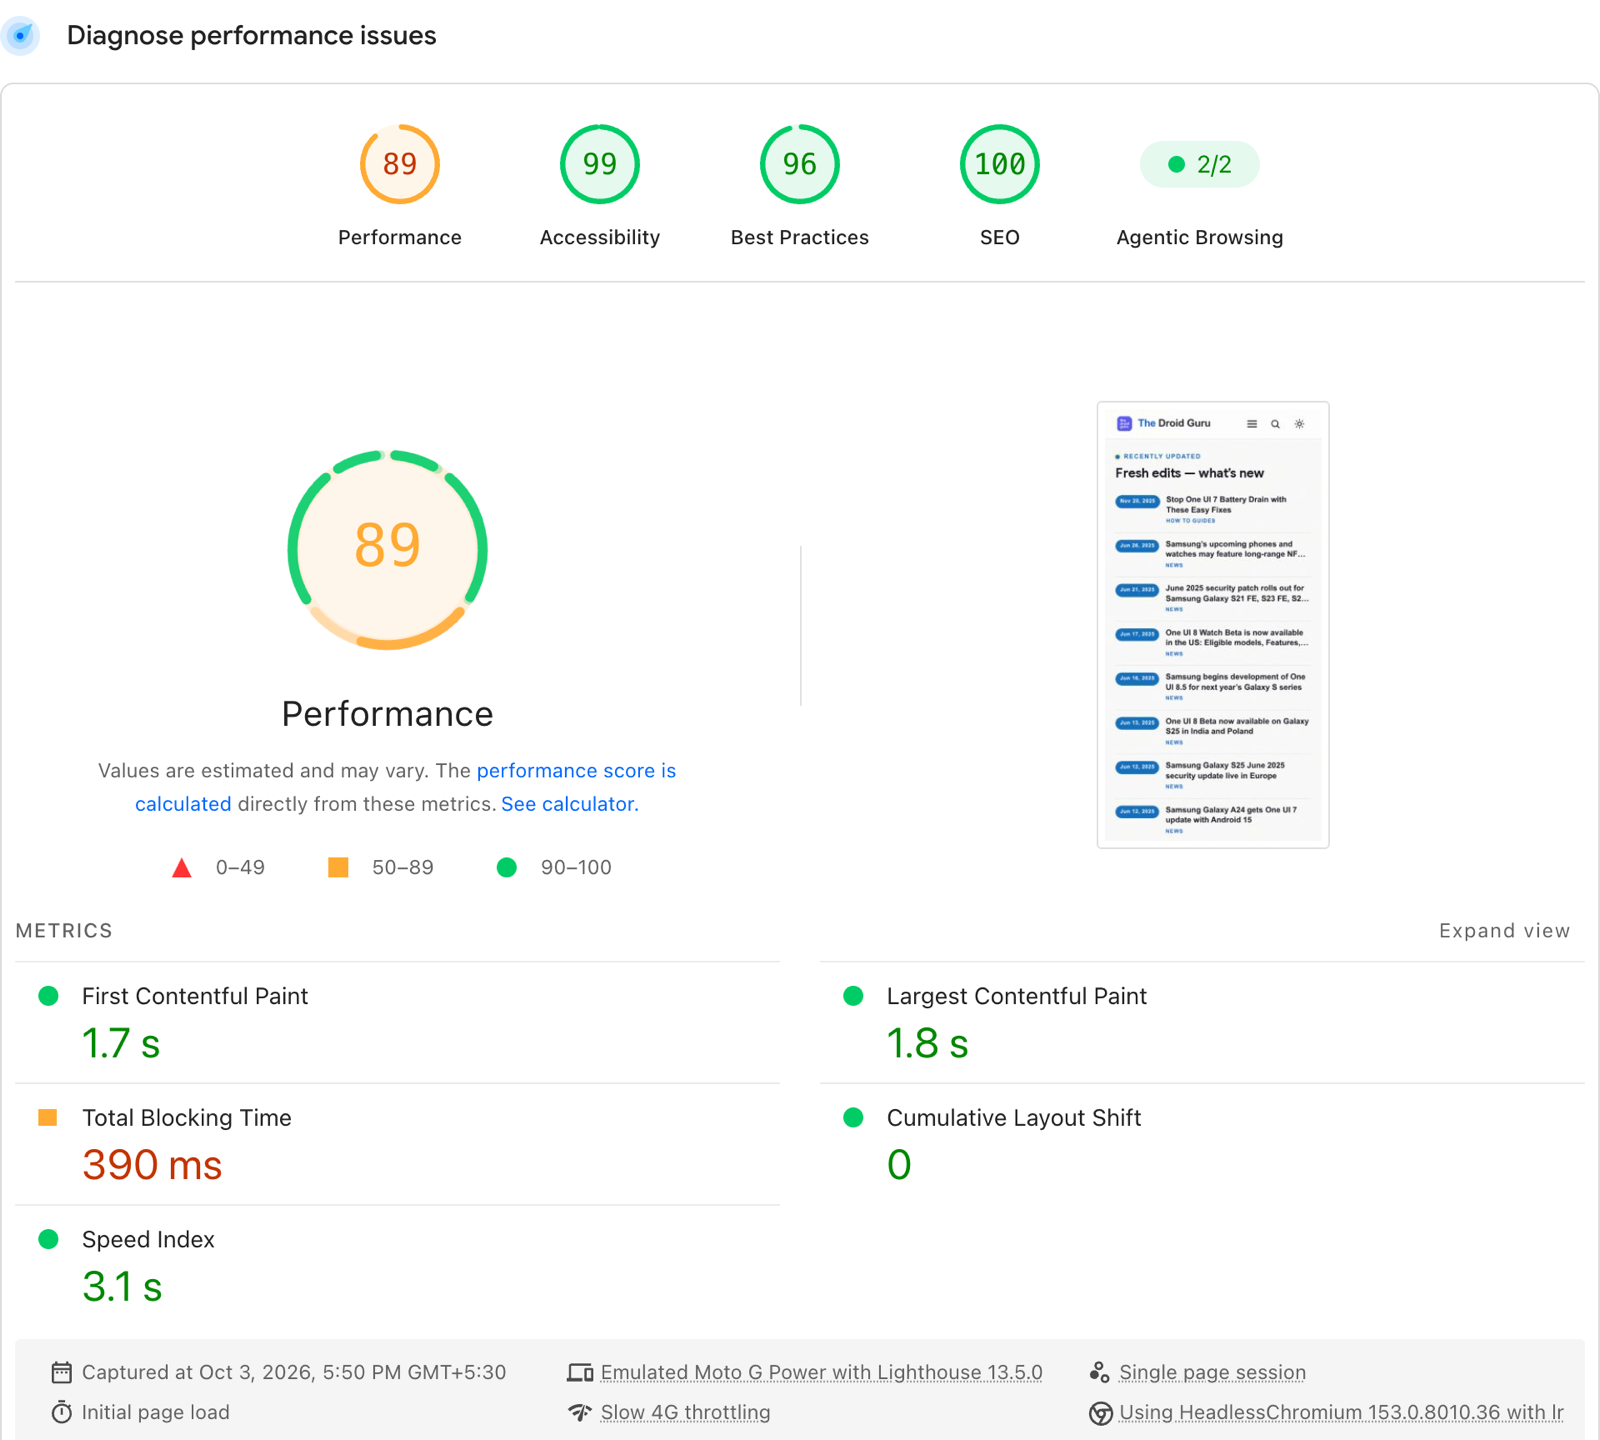
Loading looks fine. LCP is 1.8 s and layout shift is zero. The one orange number is Total Blocking Time at 390 ms, and that’s the lab metric that hints at INP trouble.
PageSpeed didn’t have field data for the site when I checked, so this post is all lab data. I will show you how to collect real visitor data at the end.
Now open the Diagnostics section.
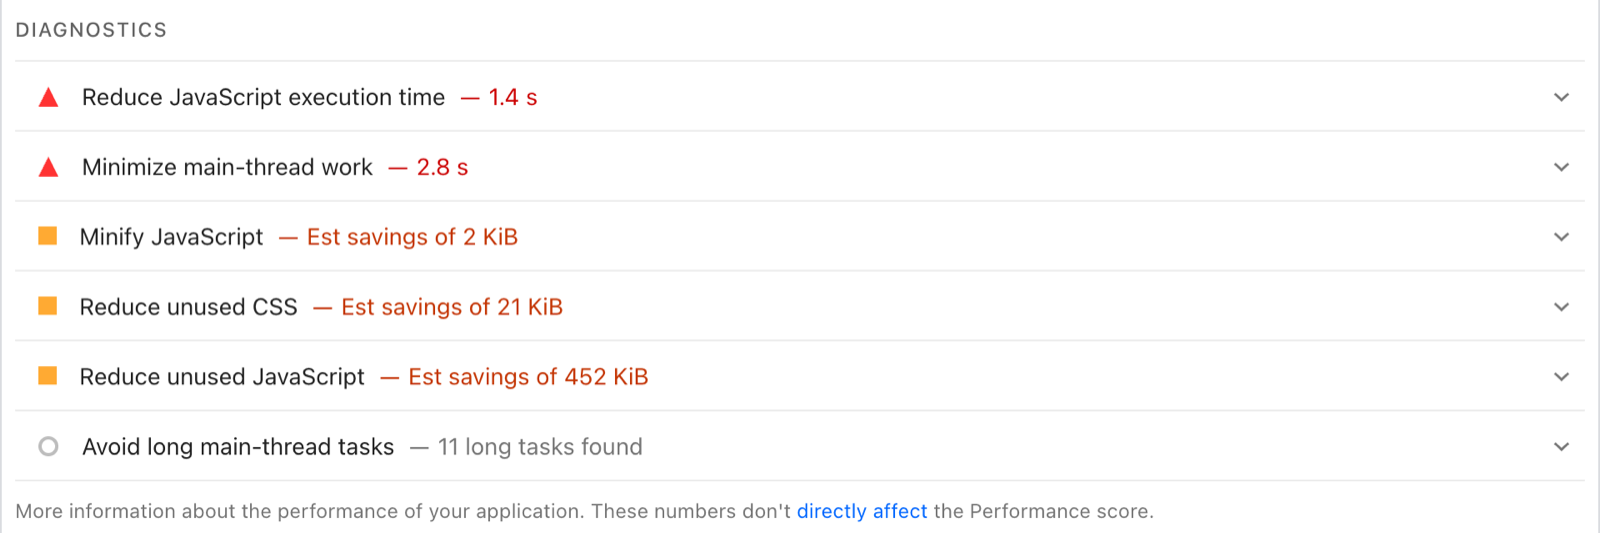
1.4 seconds of JavaScript on a site with one small theme file. Click “Reduce JavaScript execution time” and switch on “Show 3rd-party resources” to see who’s using it.
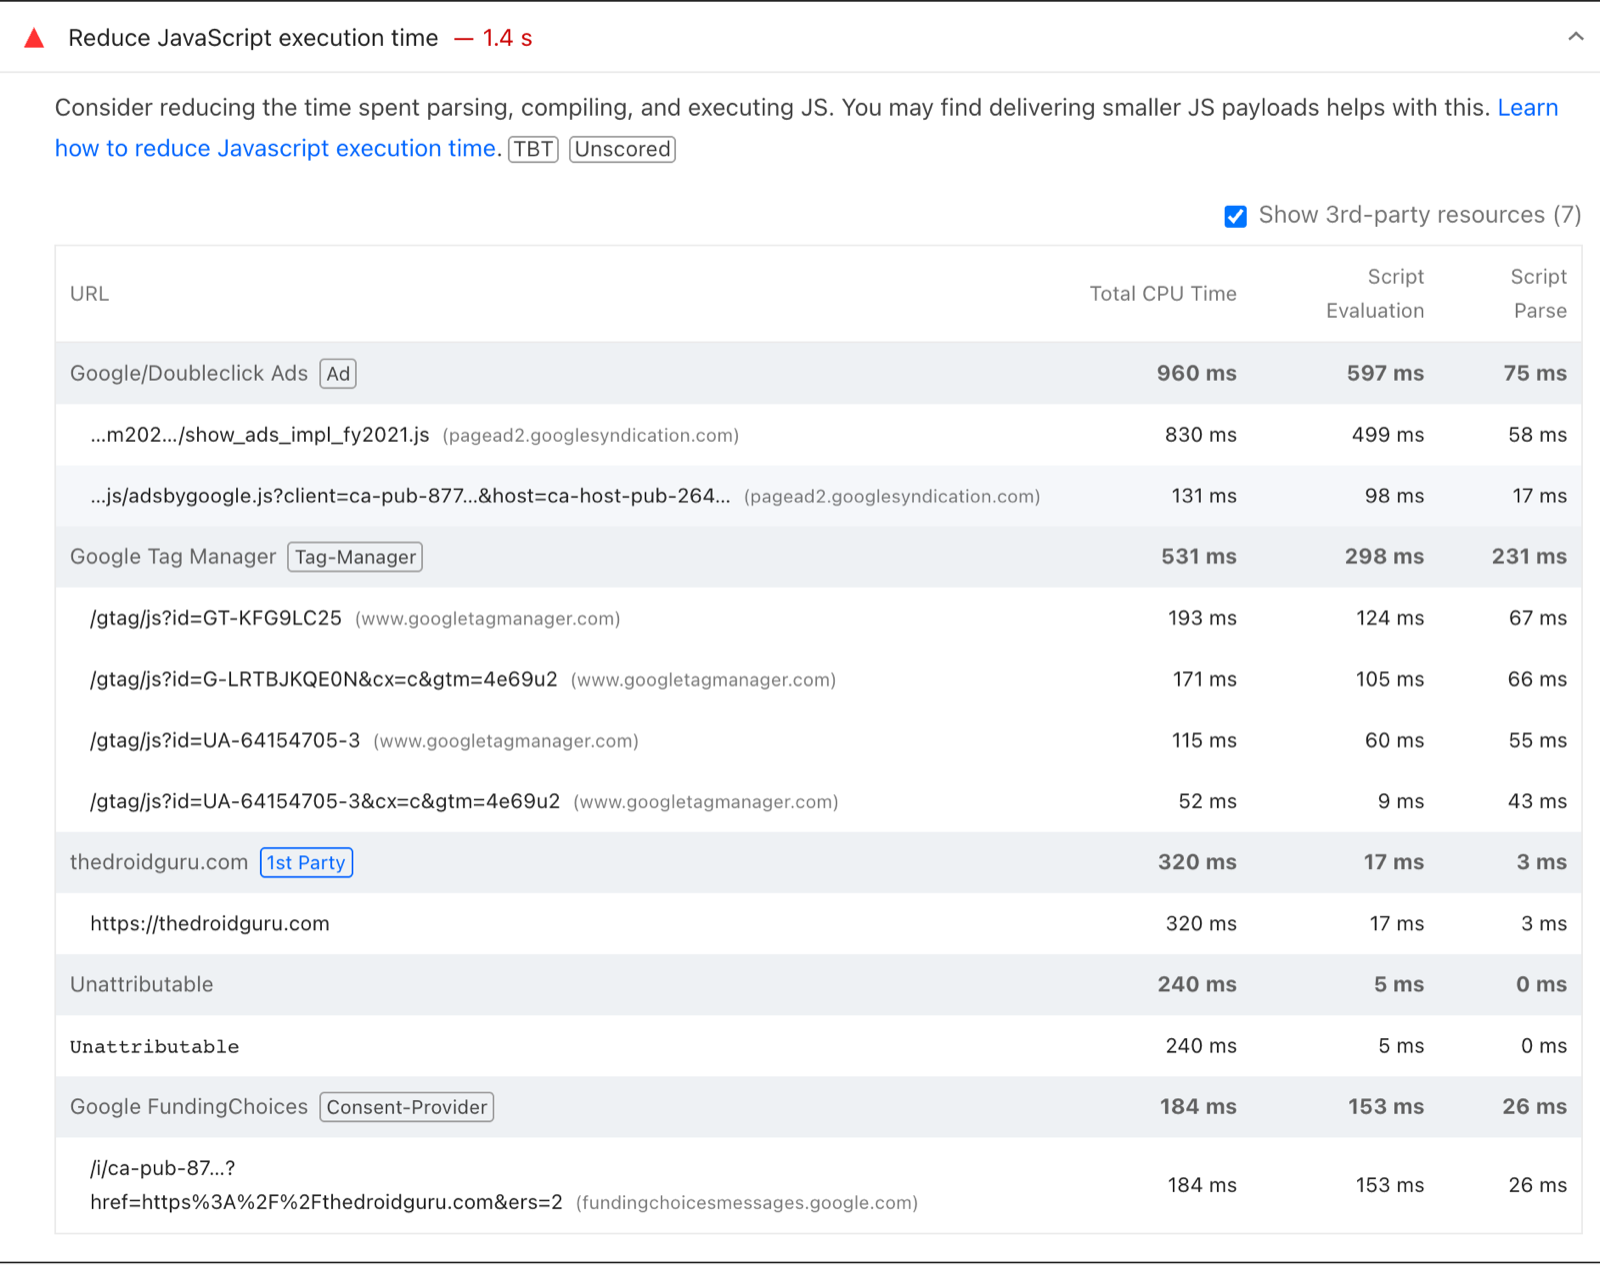
That table tells most of the story.
- AdSense used 960 ms of CPU time.
- Google’s tag (gtag.js) used 531 ms, spread across four files.
- Google’s consent message (Funding Choices) used 184 ms.
- The site’s own scripts took 17 ms to run. The rest of the 320 ms on that row is the browser reading the HTML and laying out the page.
Two of those four gtag files load a Universal Analytics ID (UA-64154705-3). Google stopped processing Universal Analytics data on July 1, 2023 and removed access to it in July 2024. So that tag is still downloading and running for an analytics property that no longer exists. I come back to it below.
How I measured INP
PageSpeed doesn’t tap anything, so it can’t give you INP. I wrote a small test with Playwright and Google’s web-vitals library to do the tapping.
- Open the article Stop One UI 7 battery drain on an emulated Galaxy S24 Ultra screen (412 x 915, touch on).
- Slow down the CPU with Chrome’s throttling. 4x is what Lighthouse uses for its mobile test. 6x is a rough stand-in for a budget Android phone.
- Tap the menu button and the dark mode button eight times at fixed moments, from 2 to 11 seconds after the page starts loading. That’s when real readers start poking around.
- Record INP, its three parts, and every long animation frame with the script that caused it.
One important thing. Every load ran AdSense in test mode by adding data-adtest="on" to the ad tag. I checked every ad request and each one carried adtest=on, so no real impressions or clicks were recorded. If you copy this test, do the same. Loading live ads with a bot is a fast way to get your AdSense account in trouble.
This is what the article looks like on the emulated phone with test ads.
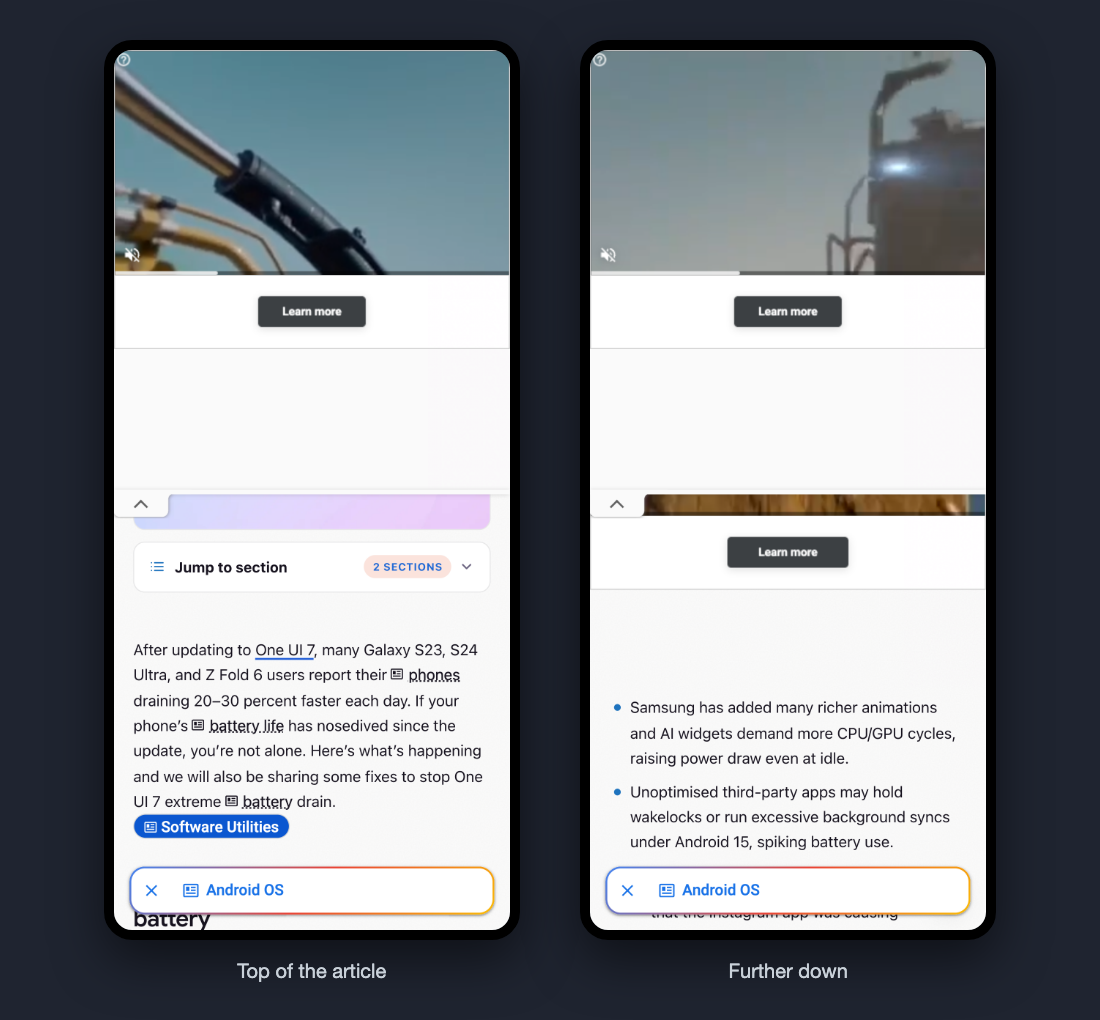
Auto ads placed nine in-page ad slots in this one article, plus an anchor ad. Look closely at the text too. The underlined words with small icons, like “phones” and “battery life”, are AdSense ad intents. Auto ads adds those links into your article text after the page loads. The “Android OS” chip at the bottom is part of the same format.
All of that is JavaScript running on your reader’s phone.
The results
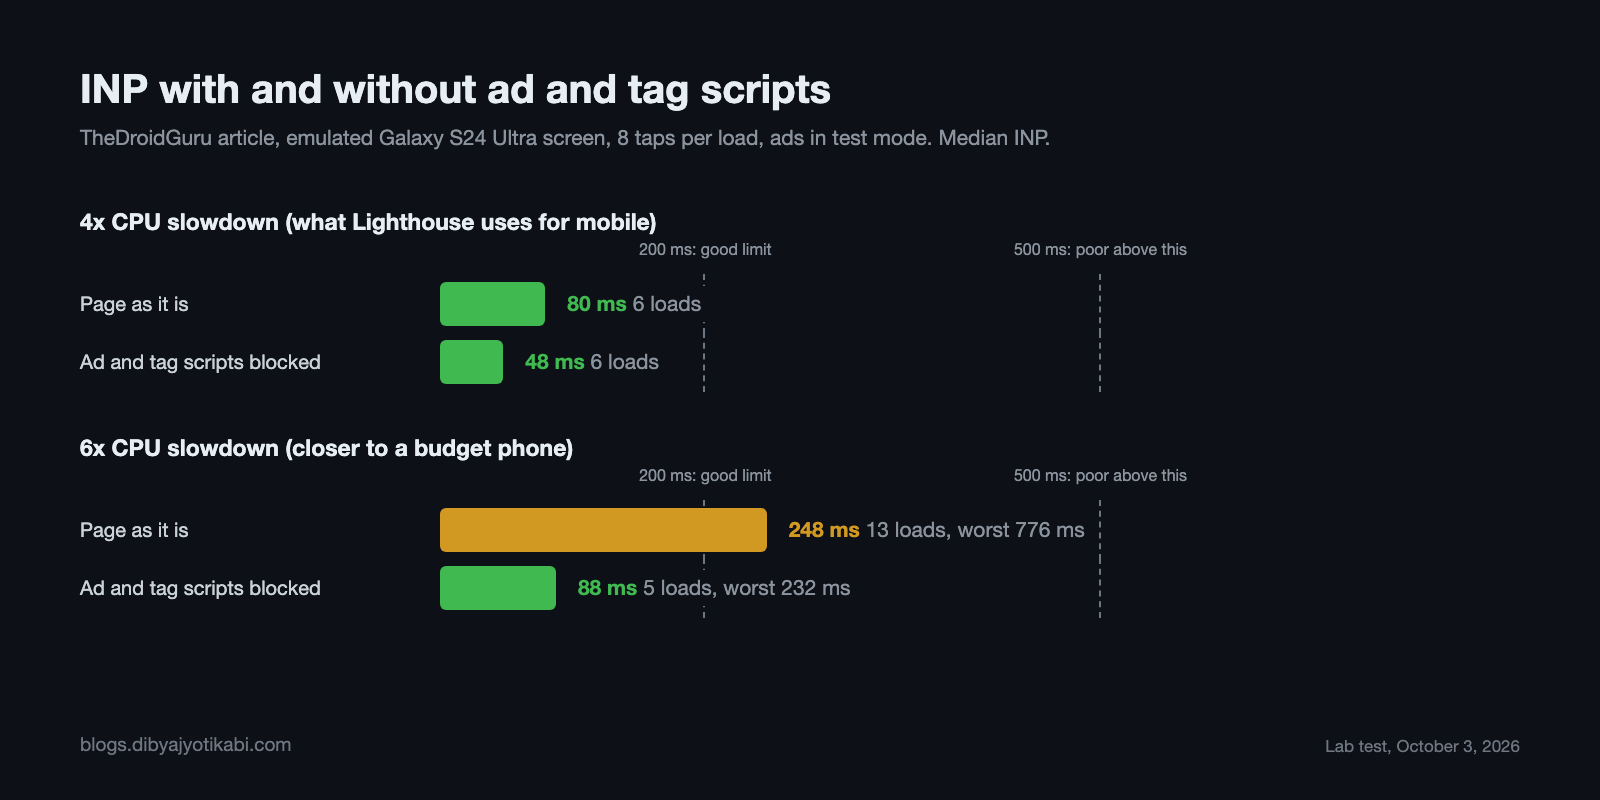
At 4x, the page passes easily. The median INP was 80 ms as it is, and 48 ms with all ad and tag scripts blocked.
At 6x, things change. The page as it is had a median INP of 248 ms over 13 loads, which is “needs improvement”. Two of those loads hit 672 ms and 776 ms, which is poor. With the ad and tag scripts blocked, the median was 88 ms.
So on a decent phone, ads cost you a few dozen milliseconds. On a slow phone, they’re the difference between passing and failing.
The long animation frames show why. With ads, the browser spent a median of about 400 ms blocked during each 4x test and about 1.5 seconds during each 6x test. Without ads, it was 48 ms and 140 ms.
Where the time goes
The Long Animation Frames API tells you which script ran during each slow frame. Here’s the average per page load at 4x.
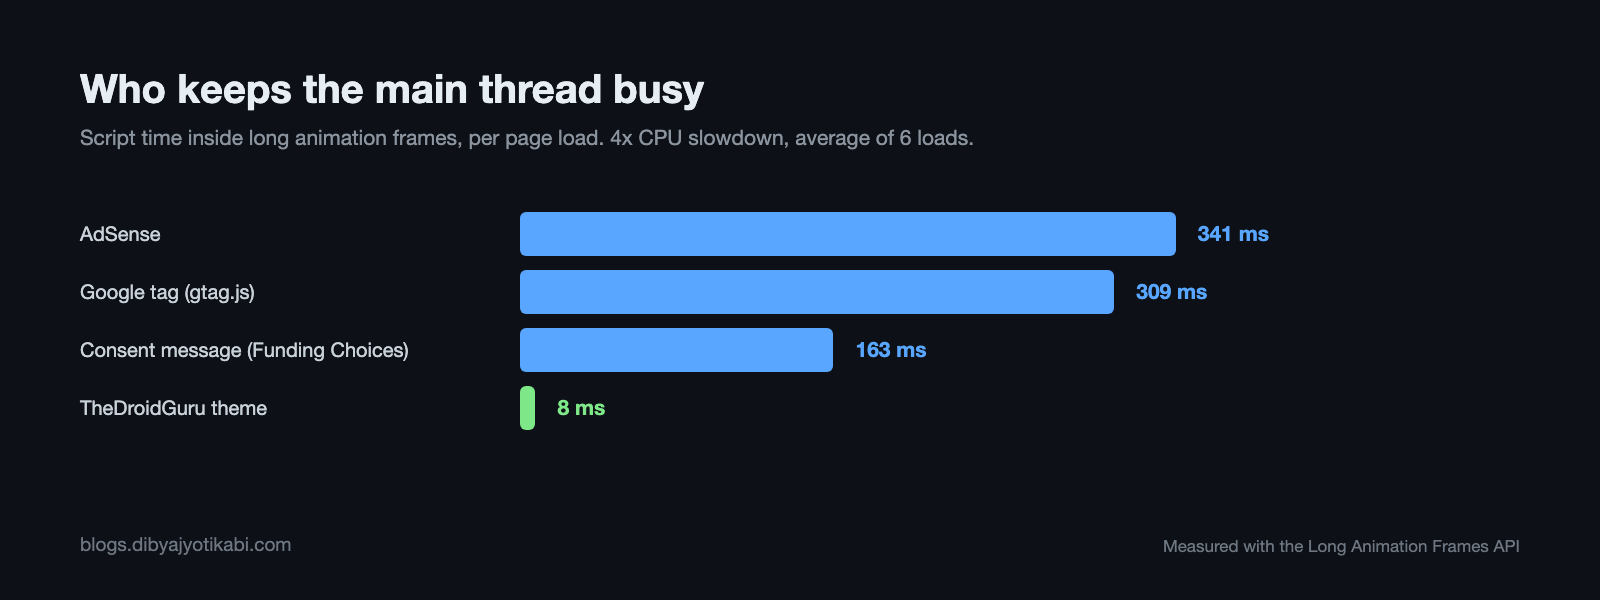
The theme’s own code was 8 ms. Everything else came from Google’s scripts.
The INP parts confirm it. At 4x, the median processing time for a tap was about 1 ms. The dark mode and menu handlers barely do anything. The time went into input delay (about 24 ms) and presentation delay (about 53 ms), which means the tap was waiting behind other work, and then the frame took longer to paint because ad code kept the main thread busy.
Here’s why this matters. If your click handlers are already tiny, rewriting them won’t fix your INP. The problem is everything else running at the same moment.
The fixes I tried
Removing the dead Universal Analytics tag
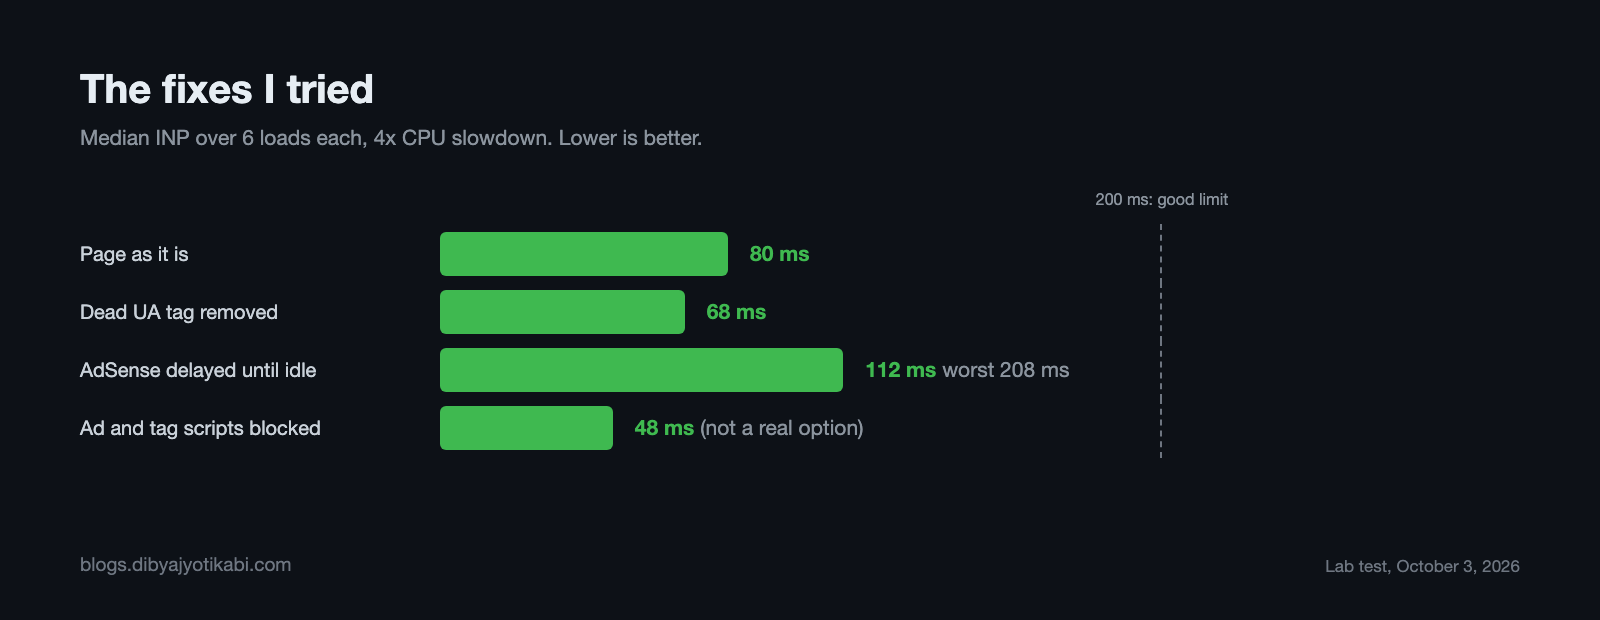
INP went from 80 ms to 68 ms. That’s small enough to be run-to-run noise, and the Google tag’s time in long frames didn’t drop.
I’d still remove it. It’s about 133 KB compressed (387 KB once unpacked) for an analytics service Google shut down over two years ago, and Lighthouse charged it about 167 ms of CPU time on the homepage. It just isn’t an INP fix on its own.
Delaying AdSense until the page is idle
This is the most common advice you’ll find. Load the ad script after the page loads, inside requestIdleCallback or a timer, so it “doesn’t block” anything.
It made INP worse. The median went from 80 ms to 112 ms, and the worst load hit 208 ms, over the good limit.
It makes sense once you see it. At load time, nobody is tapping yet. Delaying the ad script pushes all its work a few seconds later, which is exactly when readers start scrolling and opening menus. You don’t remove the work. You move it on top of your visitors.
Skipping rendering for content below the screen
I added content-visibility: auto to the related posts, author box, footer and the lower part of the article, so the browser could skip laying them out. Over eight alternating runs at 6x, the median was 192 ms against 196 ms without it. No real difference.
Blocking the consent message
At 6x this looked like a win, with a median INP of 80 ms. Then I checked the ad requests. Most of them never went out, so most ads simply didn’t load. The consent message is also how Google collects consent from visitors in Europe and the UK. So that’s not a fix, it’s a broken site.
What actually helps
Here’s what I would do on any ad-heavy WordPress site, based on these results.
- Measure real visitors first. Lab tests show you the mechanism, but only field data tells you if you have a problem. The code is in the next section.
- Remove dead and duplicate tags. Look at the gtag lines in your page source. Old UA- IDs, two copies of the Google tag, or the same ID added by a plugin and the theme are all common. Each one costs CPU on every page view.
- Don’t delay ads on a timer or until idle. Test it on your own site before you trust it. In my test it moved the work right into the interaction window.
- Keep your own click handlers small. Show the visual change first, then do the rest after the browser has had a chance to paint. The code is below.
- Review your Auto ads formats one at a time. In AdSense, go to Ads > By site and click the edit icon next to your site. You’ll see the in-page, overlay and intent-driven formats, plus the ad load slider. I haven’t tested switching them off yet, so treat this as your next experiment, not a proven fix. Change one setting, wait for a week of field data, then compare.
- Test on a slow phone, or at least with 6x CPU throttling. Your laptop will tell you everything is fine.
Give feedback first, then yield
If your handler does more than toggle a class, split it. Show the change, let the browser paint, then save settings or send analytics.
scheduler.yield() shipped in Chrome 129 and does exactly this. Here’s a dark mode toggle written that way, with a fallback for browsers that don’t have it yet.
const yieldToMain = () =>
  globalThis.scheduler?.yield
    ? scheduler.yield()
    : new Promise((resolve) => setTimeout(resolve, 0));

themeButton.addEventListener('click', async () => {
  // 1. The visible change, so the next frame shows it.
  const isDark = document.documentElement.classList.toggle('dark');

  // 2. Let the browser paint before anything else runs.
  await yieldToMain();

  // 3. The slower work happens after the user already sees the result.
  localStorage.setItem('theme', isDark ? 'dark' : 'light');
  gtag('event', 'theme_toggle', { mode: isDark ? 'dark' : 'light' });
});
This won’t stop AdSense from running. But it makes sure your own code never adds to the problem.
Measure INP on your own site
You only need the web-vitals library and an endpoint to receive the data. The attribution build tells you which part of INP was slow and which script was running at the time.
import { onINP } from 'web-vitals/attribution';

onINP(({ value, rating, attribution }) => {
  const script = attribution.longestScript;
  navigator.sendBeacon('/inp-log', JSON.stringify({
    inp: Math.round(value),
    rating,
    target: attribution.interactionTarget,
    inputDelay: Math.round(attribution.inputDelay),
    processing: Math.round(attribution.processingDuration),
    presentation: Math.round(attribution.presentationDelay),
    script: script?.entry.sourceURL,
    scriptPart: script?.subpart,
  }));
});
After a few days, group the results by the script field. If most of your slow interactions point to pagead2.googlesyndication.com or googletagmanager.com, you have the same problem I found. If they point to your theme or a plugin, the fix is in your own code.
You can also check this right now without any code. Open your site in Chrome, press F12, go to the Performance panel, set CPU throttling to 6x and tap around. The panel shows INP live as you tap. Record a trace and each long task shows you the script behind it.
A few honest notes
- This is lab data from one article on one site. Real phones, networks and ad auctions vary a lot.
- Ads ran in test mode. Live ads may load different creatives, some heavier than the test ones.
- CPU throttling on a Mac is a stand-in for a slow phone, not a perfect copy of one.
- The 6x results swing a lot between loads (from 80 ms to 776 ms). That’s what slow devices look like, and it’s why field data at the 75th percentile matters more than one lab run.
Wrapping up
That’s it. On TheDroidGuru, the theme’s own code was a rounding error. AdSense, the Google tag and the consent message did almost all the work, and on a slow phone that pushed INP from good into needs improvement and sometimes poor.
The fix most people reach for, delaying ads, made it worse. Cleaning up dead tags, keeping your handlers light, and measuring real visitors is the honest starting point.
If you run ads on WordPress and want me to look at your INP, send me your site URL and tell me which ad setup you use (AdSense Auto ads, Ad Manager, Prebid or something else). I’d like to run the same test on a Prebid setup next.